Part of our honest-charting series. See also Dual-Axis Charts: Shortcut or Trap?, Histogram vs Box Plot, and How to Clean Messy Data Before You Chart It.
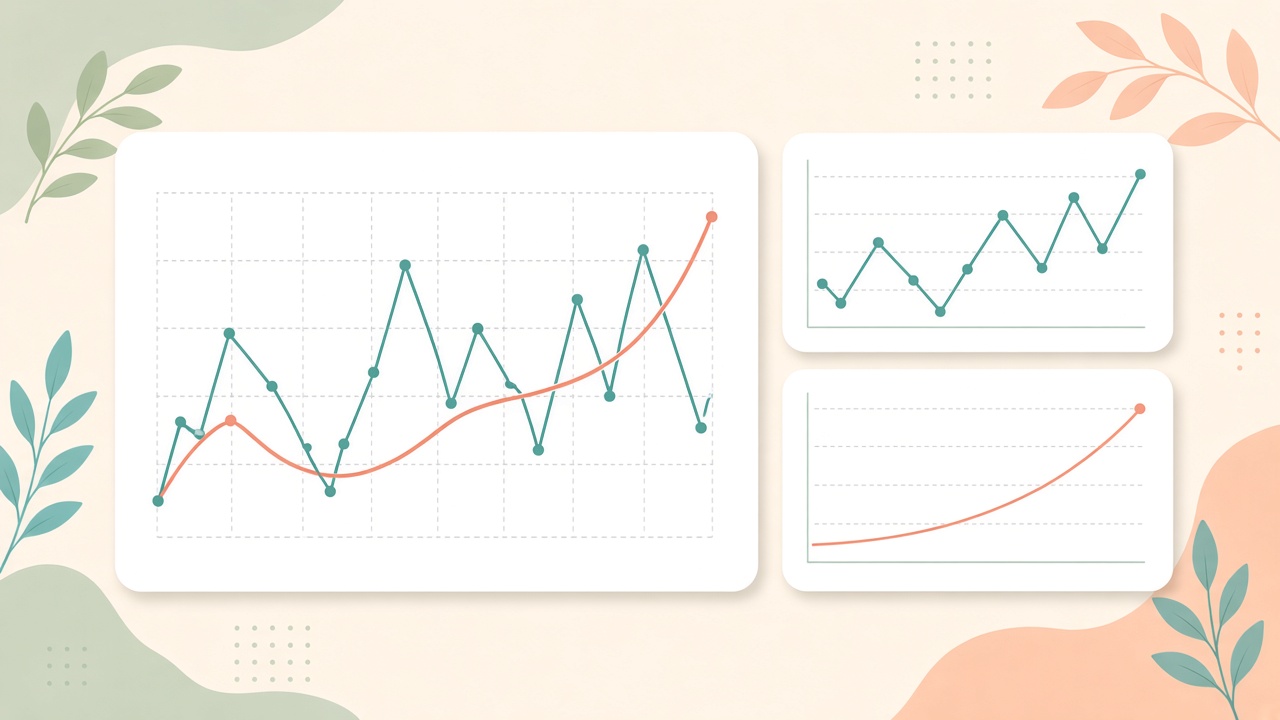
Weekly active users, twelve months, one blue line climbing left to right. The deck title says “Sustained growth.” Someone toggled on smooth line in the chart tool. The wobble disappeared. A dip in March became a gentle bend. The room nods at the trend.
Line charts are the default answer to “how did this change over time?” They are also fragile. Smoothing, truncated axes, uneven date spacing, and missing values can turn a cautious summary into a stronger story than the underlying rows support.
This guide is not anti-line-chart. It is pro-clarity: when smoothing helps you see signal, when it erases warnings you needed to show, and what to check before you export the slide.
What Line Charts Are Good At
A line chart connects ordered observations — usually dates — with straight or curved segments. It encodes continuity: the idea that values exist between the points you measured, or at least that the sequence matters.
That makes line charts ideal when:
- The horizontal axis is time (or another meaningful order, like process stage).
- Points are measured at consistent intervals, or gaps are explicit.
- The question is about direction and timing — when things rose, fell, or flattened.
- You have enough density that connecting points does not invent false stability.
When any of those break, the line still renders. That is when honesty moves from the chart type to your axis, aggregation, and smoothing settings.
Remember: A line chart shows a path through your measurements. Smoothing and axis limits show what you are willing to emphasize or hide. Those are editorial choices — label them.
Smoothing: What It Actually Does
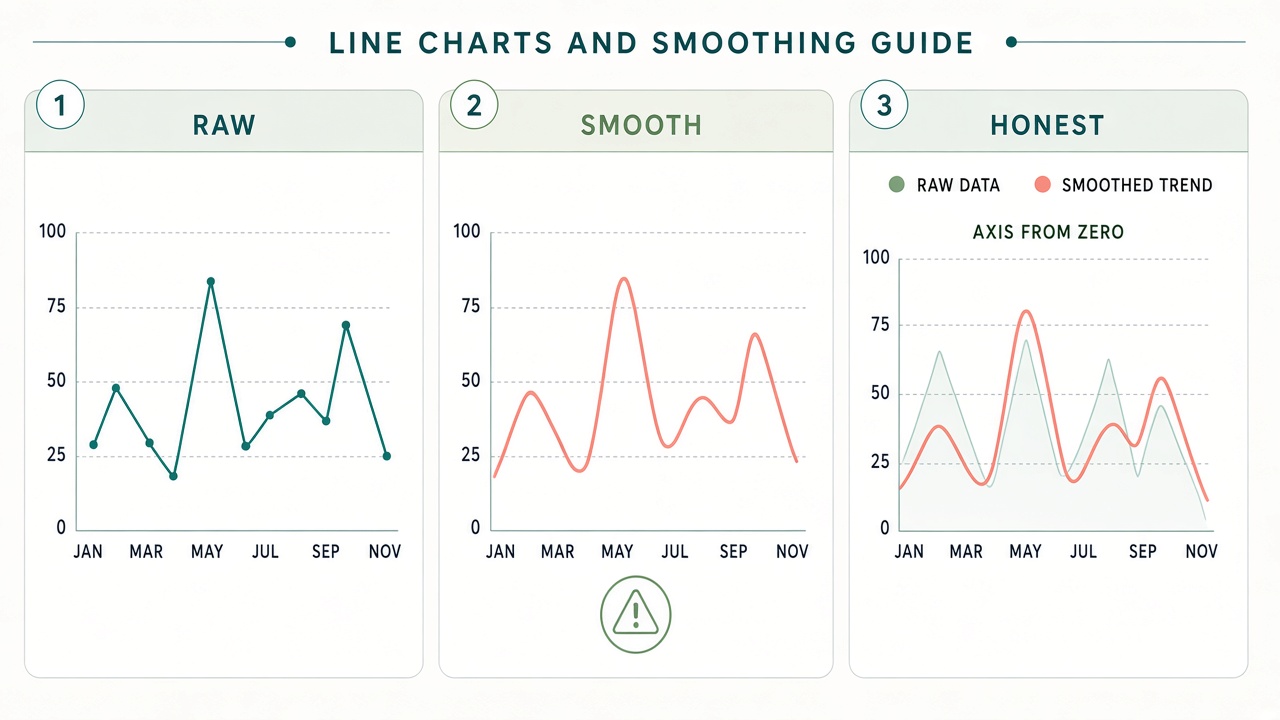
Smoothing replaces or overlays the raw series with a curve that fits the general shape — moving averages, spline interpolation, polynomial trend lines, or “beautify” modes in slide tools. The math varies; the effect is similar: high-frequency wiggles shrink, peaks and valleys soften, outliers matter less visually.
That is useful when noise dominates and the audience needs the forest, not every tree. It is dangerous when the wiggles are the story: compliance spikes, outage weeks, refund surges, or a failed experiment window.
Moving averages lag the present
A seven-day or four-week moving average lags real events by half the window (roughly). A launch bump looks delayed; a crash looks gradual. If you report “this week” KPIs to executives, a smoothed line can describe last month’s blended reality while the title says current.
Fix: Plot raw daily or weekly values lightly in the background, or show the moving average only through the prior complete period. State the window in the subtitle: “7-day trailing average, through Sunday.”
Splines imply values you never measured
Curved interpolation between points suggests the metric eased up and down in between. Stock price charts earn that suspicion; so do sparse monthly KPIs connected with aggressive splines. Two points six weeks apart do not prove a smooth mid-period path.
Fix: Use straight segments for sparse data, or show points without connecting lines. If you smooth, reduce strength until outliers remain visible.
Trend lines are regression, not prophecy
A linear or polynomial trend line summarizes correlation with time. It is not a forecast unless you label it as one and validate it. Extending a trend line past the last point without a model is decoration.
Fix: Keep trend lines within the data range, or move forecasts to a separate chart with confidence bands and documented methodology.
Dual encoding: smooth plus bold raw
The best compromise is often two layers: thin gray line or dots for actuals, thicker color for a moving average or indexed trend. If you only show the smooth layer, add a footnote that raw values are available — and mean it (table appendix or interactive tooltip).
When Smoothing Misleads
1. Volatility is the risk
Finance, infrastructure, and support teams care about tails: worst days, error bursts, chargeback spikes. Smoothing flatters those tails into minor ripples. A chart that looks “under control” can hide that one in five weeks breached SLA.
Fix: Pair the line with a band (min–max or percentile range), or add a small multiple showing weekly range bars beneath the trend.
2. Small-n series look stable
Four quarterly points smoothed into a curve feel authoritative. With n = 4, the curve is mostly interpolation fantasy. Seasonality and sample error disappear.
Fix: Show points prominently, avoid splines below ~12 regular intervals, and report sample size in the title.
3. Outliers get visually vetoed
Smoothing algorithms down-weight extremes. An fraud week or bot spike may vanish from the hero line while still sitting in the CSV. Decisions about controls and root cause never get triggered.
Fix: Annotate outliers on the chart or list them in a callout box with dates and values.
4. The smooth line crosses thresholds that raw data never did
A moving average can dip below a target while no single day missed — or the opposite, suggesting a breach when only the average failed. Threshold stories need raw or daily views.
Fix: Draw goal lines only on charts whose grain matches how the goal is enforced (daily goal → daily series).
Axis Tricks That Amplify Smooth Lines
Smoothing is not the only way to sell a trend. The Y-axis does heavy lifting — often in combination with a polished curve.
Truncated Y-axis exaggerates slope
Starting the axis just below the minimum value turns a flat 2% drift into a cliff. Smoothing plus truncation is a common “growth” template. It is not always wrong for small relative changes, but it must be disclosed.
Fix: Show a zero baseline when magnitude matters, or inset a small “context” panel with full range. Mention the axis range in text.
Two metrics, one timeline — wrong tool
Overlaying revenue and churn as two smooth lines on different scales invites parallel-trend stories. That is a dual-axis problem wearing a line-chart costume. See Dual-Axis Charts: Shortcut or Trap? for alternatives like indexed lines and small multiples.
Percent change without base rate
“Up 200%” on a line chart from 1 to 3 users is technically true and practically noise. Smoothing such a series makes it look like a mature trend.
Fix: Show absolute counts in labels or a secondary axis panel reserved for volume, not a second unlabeled scale.
Time Axis Mistakes (Before You Smooth Anything)
Garbage timing produces graceful lies.
- Missing dates collapsed: Tools often plot row order, not calendar gaps. A line jumps from Jan 31 to Mar 15 with no visual break, implying continuous change.
- Mixed grains: Daily points merged with monthly totals create fake slopes. See data cleaning before charting.
- Timezone midnight shifts: Event counts shift across days; smoothed global lines hide regional outages.
- Category axes disguised as time: “Week 1, Week 2, Launch+1” is ordinal, not calendar time. Curves imply equal spacing that may not match real duration.
Fix: Use a true date axis, show gaps for missing periods, or switch to a bar chart for irregular buckets. Smooth only after the timeline is structurally honest.
Better Alternatives for Common Questions
| Your question | Instead of one smooth line | Why it helps |
|---|---|---|
| What is the long-run direction? | Loess or moving average + faint raw line | Trend visible; volatility not erased |
| How bad can weeks get? | Line + shaded min–max band | Range encoded, not averaged away |
| Did we beat last year? | Two lines (this year vs last), same scale | Seasonality explicit; no fake smooth crossing |
| Sparse quarterly KPIs | Points + labels, straight segments | No spline fantasy between quarters |
| Executive “one number” trend | Single headline metric + sparkline raw | Matches the one chart rule |
| Relationship between two metrics | Indexed lines or scatter | Avoids dual-axis smooth parallels |
Choosing a Smoothing Window (Practical Rules)
- Match the decision cadence. If leaders act weekly, a 30-day smooth hides the week they need to fix.
- Odd windows for centered averages when you are exploring history; trailing windows when you report operational KPIs.
- Reveal the window in the title — “28-day trailing avg” beats “Trend.”
- Compare at least two settings (e.g., 7 vs 28 days). If the story flips, the story was smoothing-dependent.
- Never smooth rates without showing denominators when sample size swings (conversion with traffic collapse).
A Short Workflow Before You Publish
- Plot raw first. If the raw line already answers the claim, skip smoothing.
- Write the claim. Words like “stable,” “recovered,” or “accelerating” must survive on raw or lightly smoothed data.
- Audit the axis. Reset Y to zero and full data range; note whether the headline changes.
- Check dates. Confirm equal spacing, gap handling, and grain (daily vs monthly).
- Stress-test one bad week. If smoothing hides it, add annotation or a companion chart.
Red Flags in Review
- The presenter cannot say what smoothing method or window was used.
- Only a smooth line appears — no points, no table, no range band.
- The Y-axis has no tick labels readable at presentation size, but the curve “clearly” rises.
- Forecast extension is drawn with the same confidence weight as history.
- A single smoothed line is the only evidence for budget or headcount approval.
Smoothing is a lens, not a verdict. Used with labeled windows, visible raw data, and honest axes, it helps teams see signal in noisy operations data. Used to polish a weak year into a hero slide, it spends credibility you will need when someone opens the CSV.
Try Raw and Smoothed on the Same File
The fastest honesty check is toggling views on one dataset: raw line, moving average, truncated vs zero baseline — without re-exporting sensitive files to a cloud chart toy.
Import CSV or Excel into VantaViz, compare line settings locally, and export the version that matches the claim you can defend in review.
Plot time series without sending data to the cloud
Explore line charts, axis options, and exports on your machine — privacy-first, 30+ chart types.
Get Started Free