Part of our honest-charting series. See also Line Charts and Smoothing, Histogram vs Box Plot: When Each Chart Lies to You, and The One Chart Rule.
Revenue on the left axis. Conversion rate on the right. Both lines climb through Q2, dip in August, and recover in September. The slide title says “Performance overview.” The room reads something stronger: “When revenue moves, conversion moves with it.” Nobody ran a correlation. The chart did the work anyway.
That is the dual-axis chart in its most common form: two Y-scales sharing one X-axis, usually time. It is fast to build, fits on one slide, and handles metrics with different units without normalizing anything. It is also one of the easiest ways to suggest causation, alignment, or divergence that the underlying table does not support.
This is not a blanket ban. It is a decision guide: when a second axis is a reasonable shortcut, when it is a trap, and which alternatives answer the same business question with less ambiguity.
What a Dual-Axis Chart Actually Does
A dual-axis line or column chart plots series A against the left Y-scale and series B against the right Y-scale, with a shared horizontal dimension — almost always time. Each scale is independent. Min, max, and tick spacing on the left do not constrain the right.
That independence is the feature and the bug. You can make almost any two lines touch, cross, or mirror each other by adjusting axis ranges. The geometry looks like relationship. Often it is only co-placement.
Remember: A dual-axis chart compares shapes on a shared timeline. It does not compare magnitudes or prove correlation unless you analyze those separately and design the chart to show only what you verified.
Why Teams Reach for It
The shortcut is real. Marketing wants spend and signups on one slide. Finance wants revenue and margin percent. Product wants active users and error rate. The units differ by orders of magnitude. A single axis would flatten one series into a flat line or turn the other into a spike at the edge of the plot.
Dual axes avoid the extra step of indexing or building two panels. In a deadline-driven deck, that matters. The trap is assuming the chart type matches the question. “Show both trends together” is a layout request. “Do these trends move together?” is a statistical question. One chart type cannot answer both without help.
When Dual-Axis Charts Mislead
1. Crossings look like events
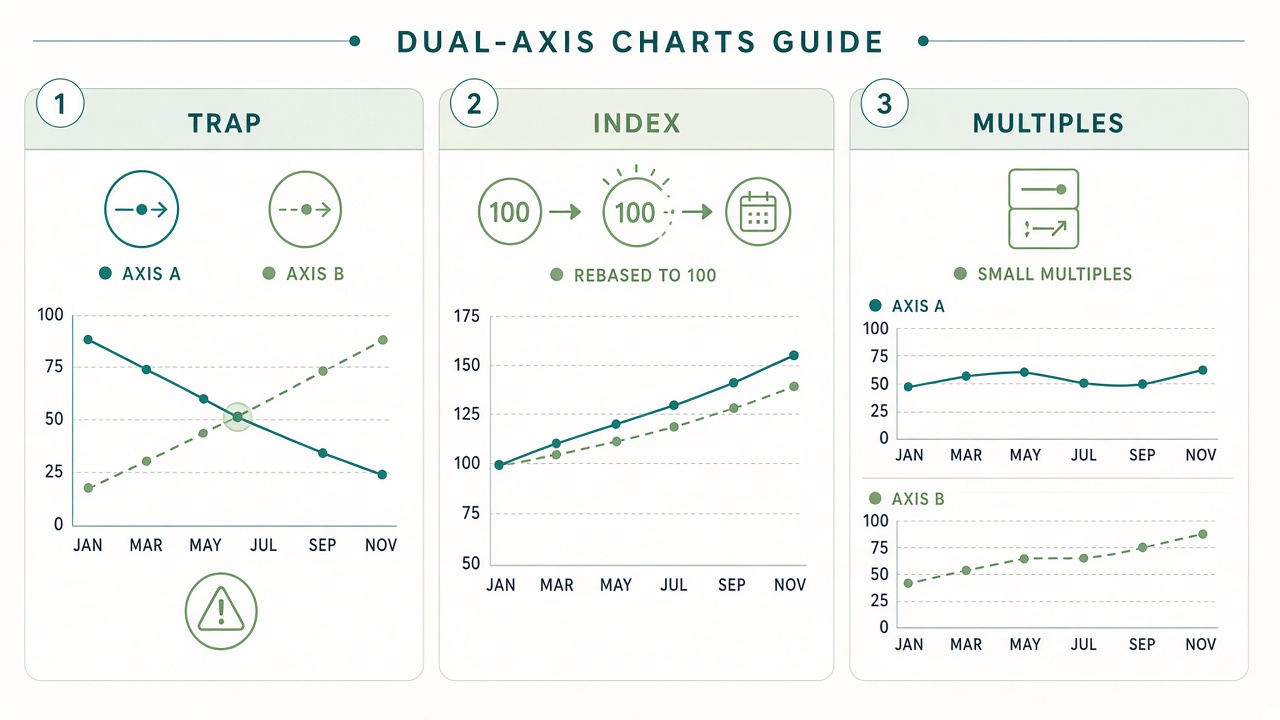
When a blue line crosses an orange line on a dual-axis chart, audiences treat the intersection as meaningful — the moment one metric overtook the other. But the two lines live on different scales. A crossing is often a side effect of where you set the axis minimum and maximum, not a real-world threshold.
Fix: If the claim is about one metric passing another, plot both on a single axis after converting to the same unit (percent, index, or dollars). If the units cannot be unified, do not use crossing as narrative.
2. Parallel lines imply correlation
Human vision is good at spotting parallel movement. Two lines that rise and fall in sync look correlated even when the correlation coefficient is weak or zero. Seasonality makes this worse: many business metrics rise in Q4 regardless of each other.
Fix: If the question is relationship, show a scatter plot with one metric on each axis, or report the correlation explicitly in the title or subtitle. For time, consider detrending or comparing year-over-year changes instead of raw levels.
3. Scale choices are invisible arguments
Starting the left axis at zero while the right axis starts at 80% of its range can exaggerate divergence. Truncating both axes can hide a flat decade and make noise look like a crisis. Because each side is labeled separately, reviewers rarely check both ranges with equal skepticism.
Fix: State ranges in the subtitle: “Left: revenue ($M), 0–50. Right: NPS, 20–60.” Better: use alternatives where scale is shared or obviously normalized (see below).
4. Bars plus lines double the confusion
Column bars on one axis with a line on the other is a popular template. It encodes two chart types, two scales, and often two different aggregation levels (monthly bars, daily line). Legends get long; color meaning splits across geometry and hue.
Fix: Use bars for one metric only, or lines for both. If you need two geometries, split into small multiples with the same x-axis and aligned grid lines.
5. The slide title overclaims
“Overview” slides with dual axes invite the audience to invent the story. Without a sentence-level claim — “Support volume rose while CSAT held steady” — viewers supply their own, usually stronger, causal link.
Fix: Title the slide after the verified claim. If you cannot write that sentence from the data alone, the chart is exploratory; label it that way and follow up with analysis.
When a Second Axis Can Be Defensible
Dual axes are least harmful when all of the following are true:
- The audience already knows the metrics are unrelated in scale and you are only showing timing (e.g., overlaying a product launch date on a revenue series while showing a secondary operational metric).
- Axis ranges are fixed and documented, not tuned until the lines “look right.”
- The narrative does not depend on crossings, relative slope, or visual correlation.
- You have checked whether a simpler layout — two stacked charts — fits the slide without losing clarity.
Even then, treat the dual-axis chart as a monitoring convenience, not evidence in a decision memo. For budget, pricing, or policy conversations, prefer layouts where scale manipulation is harder.
Better Alternatives for Common Questions
| Your question | Instead of dual axis | Why it helps |
|---|---|---|
| Did both metrics move together over time? | Indexed line chart (100 = start date) | One scale; compares percent change, not mixed units |
| Are they actually correlated? | Scatter plot + correlation in title | Relationship is explicit, not inferred from overlay |
| How do levels compare each month? | Small multiples (two panels, shared x) | Each metric gets an honest axis; alignment stays visual |
| One metric is tiny on the same scale | Panel with broken axis, or separate chart | Avoids hiding small but important variation |
| Show event + outcome | Single-axis line + vertical event marker | Event annotation does not need a second metric scale |
| Executive one-slide summary | One primary chart + one number callout | Matches the one chart rule |
Indexed Lines: The Most Underused Fix
To compare shape without comparing units, rebase both series to 100 at a chosen date (or 0% change from baseline). Revenue might move from 100 to 118 while ticket volume moves from 100 to 105. One Y-axis, one story about relative change. The absolute dollars and ticket counts belong in a table or tooltip, not crammed into two competing scales.
Indexed charts still require honesty: pick the baseline date and say so. A launch week, fiscal year start, or pre-campaign month all change the picture. If the baseline is cherry-picked, the single axis will lie as confidently as two.
Small Multiples Beat “One Busy Slide”
Two thin charts stacked vertically — same time range, aligned grid, consistent colors — take slightly more vertical space but remove an entire class of misread. The eye still tracks sync in time. It no longer treats line crossings as meaningful. This pattern scales to three metrics better than a third Y-axis ever should.
When building multiples, match x-axis ticks and keep bar width or line thickness consistent. The goal is rhythm, not decoration. If only one panel needs a truncated axis, say why in a footnote so reviewers do not assume the same truncation on the other.
A Short Workflow Before You Publish
- Write the claim first. If the claim mentions “correlation,” “impact,” or “drives,” dual axis is probably the wrong default.
- Try indexed or multiples. If the story survives on one scale or two panels, drop the second axis.
- Stress-test ranges. Reset both axes to zero or to full data min/max. If the headline changes, the headline was scale-dependent.
- Check seasonality. Plot year-over-year or month-over-month change to see if parallel lines are just calendar effects.
- Clean the table first. Misaligned dates, mixed grains (daily vs monthly), and null gaps distort both lines equally — dual axes do not fix bad joins. See How to Clean Messy Data Before You Chart It.
Red Flags in Review
- Left and right axes use different colors but the legend does not tie color to axis side.
- The presenter says “as you can see, when A went up, B went up” without a statistical check.
- One series is bars and the other is a line, and the bar axis starts above zero.
- The chart was resized in the slide tool and axis labels are too small to read — but the lines still “look” related.
- A dual-axis chart is the only visual in a decision deck; the room is asked to approve spend based on visual parallelism.
Dual-axis charts are a layout shortcut, not an analytical free pass. Used with a narrow, timing-only question and explicit ranges, they can save space. Used to imply connection, they outsource your credibility to whatever default scales the tool chose.
Iterate Locally Before the Meeting
The fastest way to choose between dual axis, indexed lines, and small multiples is to plot all three on the same filtered dataset and ask which version a skeptical colleague could misread. Tools that let you switch chart types without re-uploading sensitive data make that loop practical — especially when the CSV never leaves your device.
Try the same columns in VantaViz: import CSV or Excel, compare dual-axis and single-axis views locally, and export the layout that matches the claim you are willing to defend.
Compare chart layouts on your data
Import CSV, Excel, or JSON in VantaViz and explore dual-axis, indexed, and multi-panel views — processed locally on your device.
Get Started Free