
Every time you upload a spreadsheet to a cloud-based charting tool, you are doing more than creating a bar graph. You are sending customer names, revenue figures, health records, or employee salaries to a server you do not control — often in a jurisdiction governed by someone else's rules.
Data visualization feels harmless because the output looks abstract: colorful bars, smooth lines, elegant pie slices. But the raw data behind those charts is anything but abstract. It is some of the most sensitive information your organization holds.
The Hidden Risk in "Just Making a Chart"
Most teams treat visualization as the last step of analysis — quick, visual, shareable. That convenience comes with a trade-off most people never read in the fine print:
- Data leaves your device. CSV, Excel, and JSON files are uploaded to third-party servers for processing.
- Retention policies vary. Some platforms cache your data for days; others keep it indefinitely for "model improvement."
- Access controls are opaque. You rarely know who can see your datasets — engineers, support staff, or automated systems.
- Compliance becomes complicated. GDPR, HIPAA, and industry-specific regulations require you to know exactly where data is stored and processed.
Key insight: A chart is only as private as the pipeline that created it. If your data transited through a cloud API, your visualization inherits every privacy risk of that upload.
Local vs. Cloud: What Actually Happens to Your Data
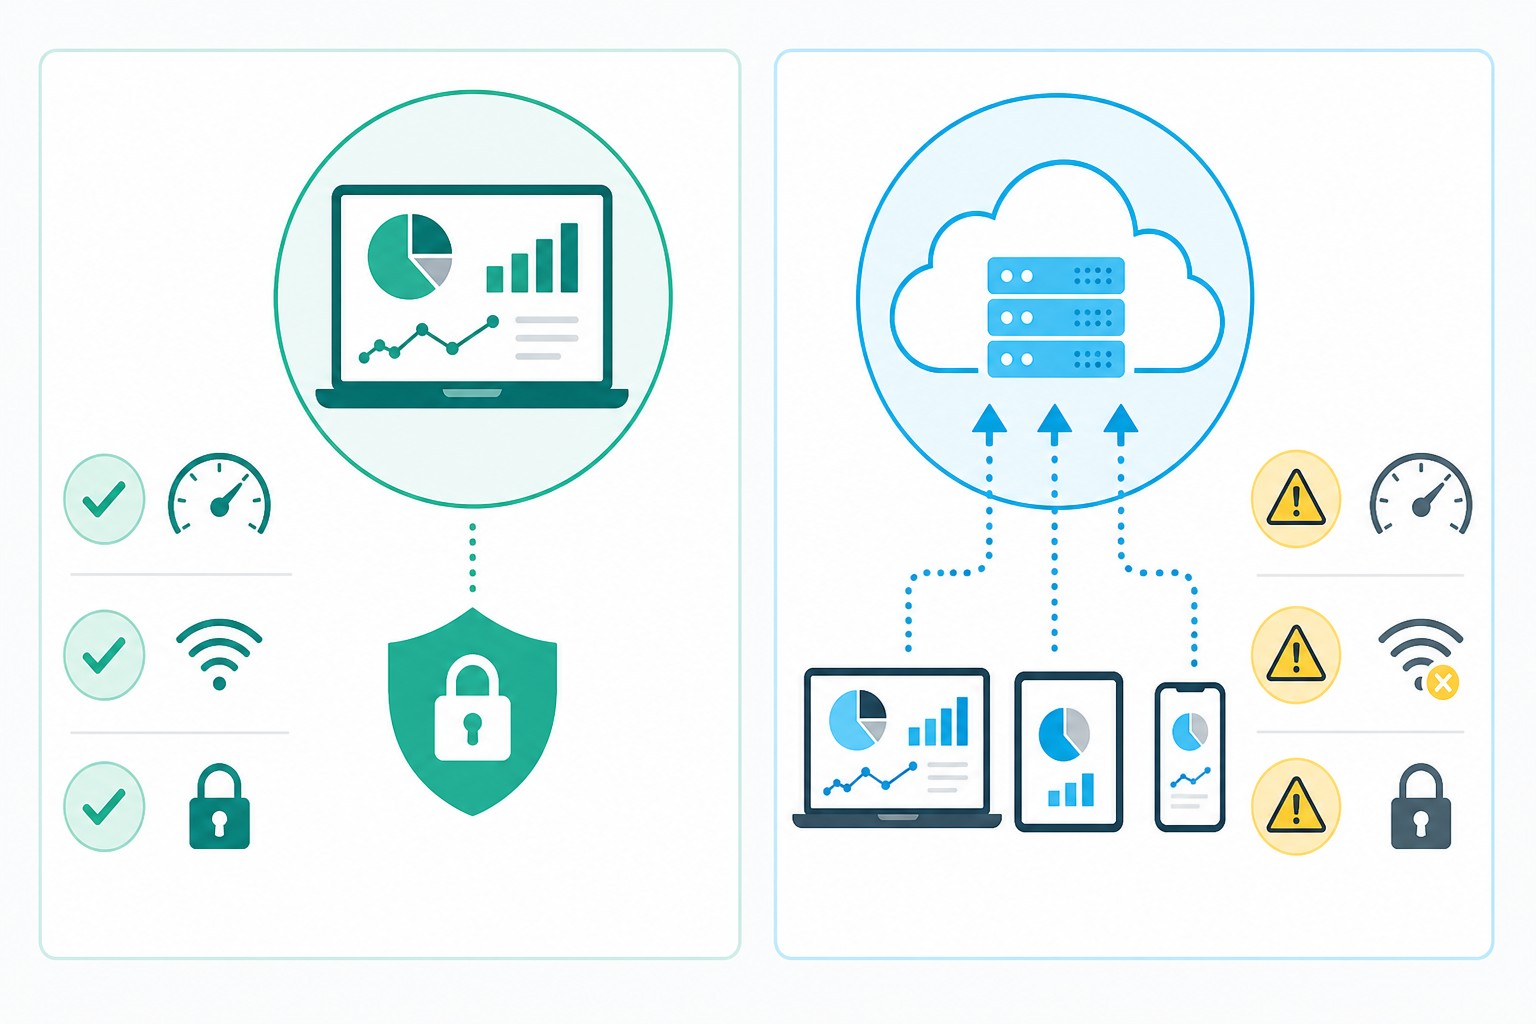
The fundamental difference between local-first and cloud-based visualization is where computation happens.
| Aspect | Local-First (VantaViz) | Cloud-Based Tools |
|---|---|---|
| Data upload | None — files stay on your device | Required for every session |
| Processing location | Your browser or desktop app | Vendor's remote servers |
| Offline capability | Works without internet | Requires connection |
| Data retention | You control deletion | Subject to vendor policy |
| Compliance audit | Straightforward — data never leaves | Requires vendor assessments |
Who Should Care Most?
Privacy-first visualization is not just for security teams. If any of these describe your work, local processing should be your default:
Finance & Investment
Portfolio positions, transaction histories, and client P&L reports contain material non-public information. Uploading them to a SaaS charting tool creates unnecessary exposure — and potential regulatory liability.
Healthcare & Life Sciences
Patient records, clinical trial results, and lab data fall under strict frameworks like HIPAA. Even de-identified datasets can be re-identified when combined with other sources. Keeping visualization local eliminates an entire class of breach vectors.
HR & People Analytics
Salary bands, performance reviews, and diversity metrics are deeply personal. Employees trust that this data stays internal. A cloud upload — even to a "trusted" vendor — breaks that trust silently.
Research & Academia
Unpublished findings, survey responses with PII, and proprietary datasets need to remain confidential until publication. Local tools let researchers iterate on visualizations without leaving a digital trail on external servers.
Five Practical Steps to Visualize More Safely
- Audit your current toolchain. List every tool that touches your data from import to final chart. Mark which steps involve cloud uploads.
- Classify your datasets. Tag files as public, internal, confidential, or restricted. Restricted data should never leave your network.
- Choose local-first by default. Tools like VantaViz process CSV, Excel, and JSON entirely in your browser — zero cloud uploads, 30+ chart types.
- Minimize what you share. When collaboration requires sharing, export only the chart image — not the underlying dataset.
- Document your data flow. For compliance audits, maintain a simple diagram showing where data enters, transforms, and exits your organization.
The Future Is Local-First
Browser technology has reached a tipping point. Modern JavaScript engines can parse million-row spreadsheets, render complex interactive charts, and apply statistical transforms — all without a round trip to a remote server. The performance gap between local and cloud processing has effectively closed for most business use cases.
What has not closed is the privacy gap. Every cloud upload is a permanent decision about who can access your data, how long it is stored, and what happens if the vendor is breached or acquired.
Local-first visualization gives you the best of both worlds: the speed and richness of modern charting tools, with the assurance that your data never left your desk.
Ready to visualize without uploading?
Try VantaViz free — import your data, build charts locally, and keep full control.
Get Started Free