Part of our chart selection series. See also How to Choose the Right Chart for Your Data and Histogram vs Box Plot: When Each Chart Lies to You.
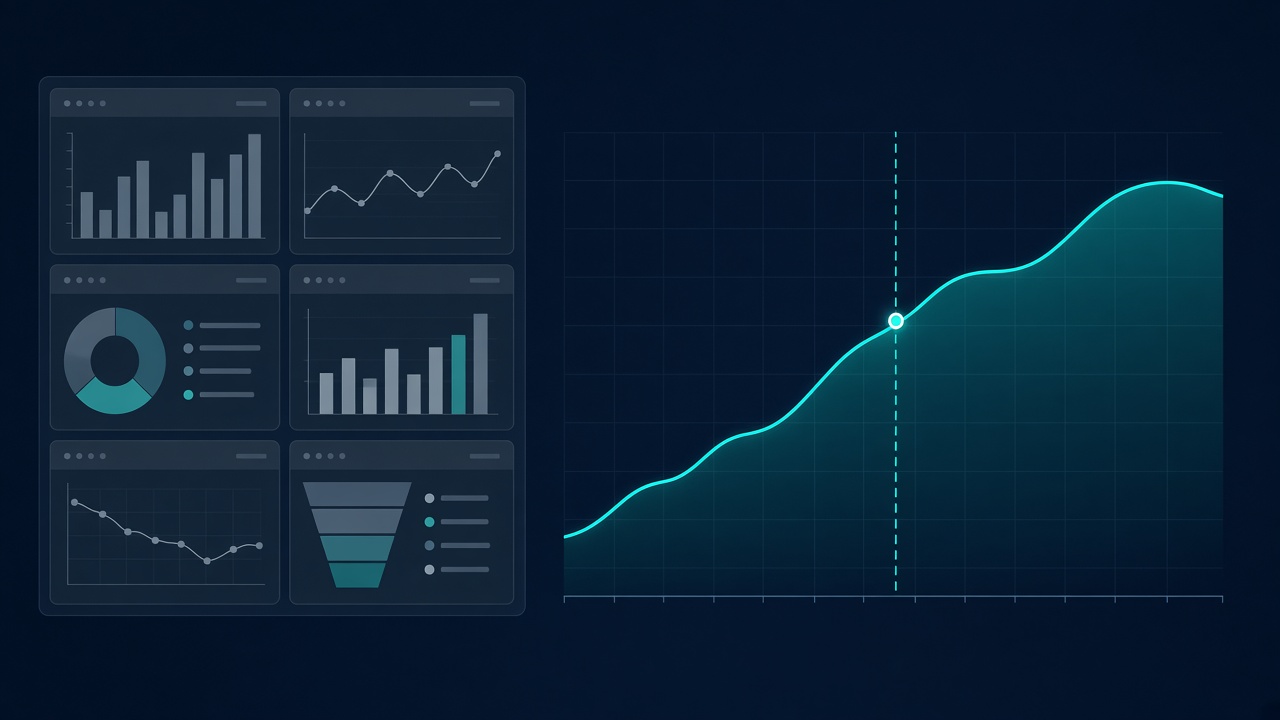
The slide has six panels. Revenue is up. Churn is flat. NPS dipped. Support tickets spiked in one region. A funnel shows conversion holding steady. Each chart is readable on its own. Twenty minutes later the room has debated axis scales, asked whether the NPS dip is statistically meaningful, and wondered aloud if the ticket spike correlates with the product launch. Nobody has decided what to do next week.
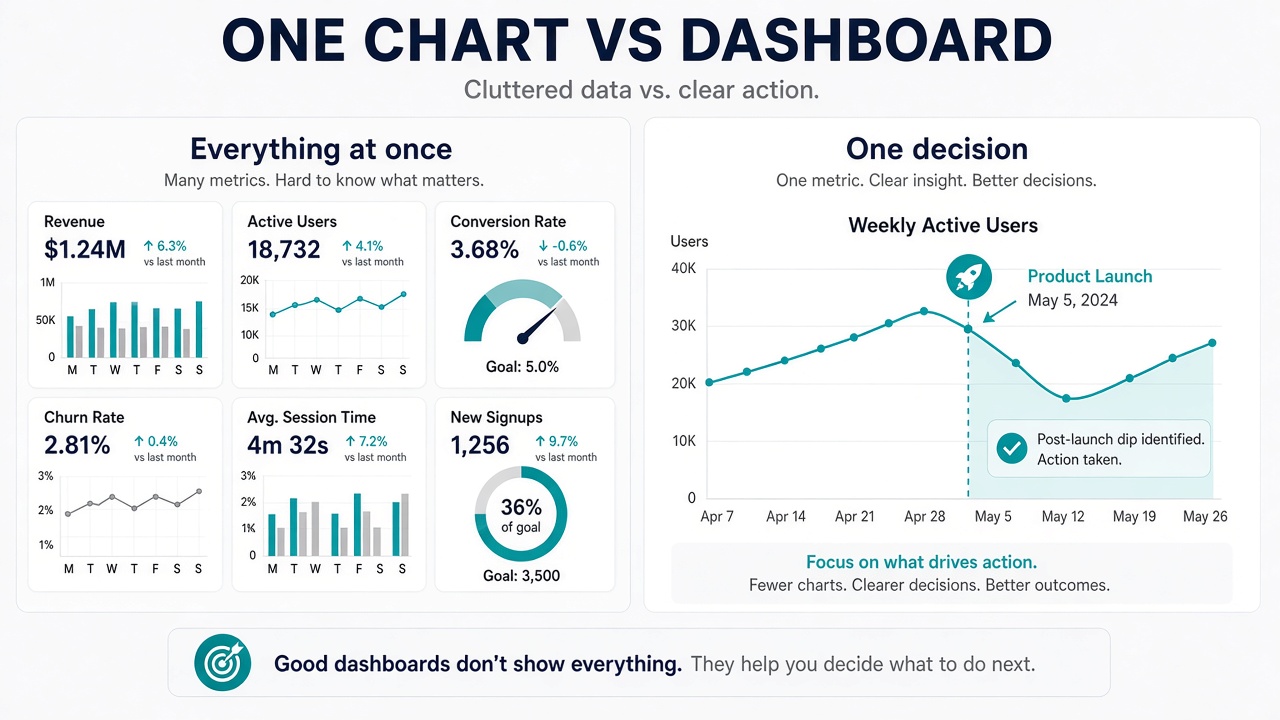
That is not a design failure. Each tile is fine. The problem is scope. The dashboard was built to cover every angle, and the meeting had one question: Should we shift budget from paid search to onboarding? Six charts can defend six different answers. One chart would have forced the conversation to stay on the budget.
We call this the one chart rule: when a meeting exists to make one decision, show one visual built for that decision. Not because dashboards are useless — they are essential in other contexts — but because attention does not scale with panel count. Every additional chart is a fork in the road the audience may take without you.
What Dashboards Are For
Dashboards earn their place when the job is monitoring, not deciding. A support lead glancing at ticket volume every morning needs a stable set of metrics at a glance. An ops team watching server latency needs thresholds, trends, and breakdowns in one view because any one of them might be the problem today. The reader chooses where to look. That is the contract.
Dashboards also work when the audience is heterogeneous. Finance cares about margin. Product cares about activation. Sales cares about pipeline. A shared screen with separate sections lets each person find their slice without scheduling three meetings. The cost is focus — and that cost is acceptable when no single outcome is on the line.
Where dashboards break down is the narrative meeting: a quarterly review, a budget request, a post-mortem, a pitch to leadership. These meetings have an implied verb — approve, cut, delay, invest, stop. The data should serve that verb. A wall of KPIs treats every metric as equally urgent, which means none of them is.
When One Chart Is Enough
Single-visual presentations work when you can finish this sentence before you open your laptop: By the end of this meeting, I want them to believe ___. If the blank is a single claim — "enterprise deals slipped, not SMB churn" or "the new pricing tier is cannibalizing the old one, not expanding the base" — one chart can carry it. The chart is evidence for a sentence you already know how to say.
They also work early in analysis. You are still forming the question. Plotting one relationship — signups against ad spend, refund rate against shipping time — keeps you honest. A premature dashboard locks you into a layout before you know what matters. One chart is easier to throw away, which is a feature when you are wrong.
Finally, one chart wins when your audience is non-technical and time is short. Executives, clients, and cross-functional groups do not want to navigate your layout. They want you to tell them what you see. A single large visual with a plain title functions as a shared object: everyone looks at the same thing while you talk. A dashboard invites parallel reading, which is another way of saying people stop listening.
The test: If removing any panel from the slide would not change the decision, that panel should not be on the slide.
How to Pick the One Chart
Start with the decision, not the data. Write the headline you would put in an email subject line: "Q3 miss driven by enterprise slip" or "Onboarding drop-off doubled after step three." The headline picks the chart type. A miss driven by one segment wants a bar or line comparing that segment to plan. A drop-off at step three wants a funnel or step chart. A change over time wants a line with a marked event, not a pie.
Then remove everything the headline does not need. If the claim is about enterprise, SMB bars are noise even if SMB numbers are interesting. Put them in the appendix or the footnote. The one chart rule is as much about what you leave out as what you show. Choosing the right chart type matters here — not because one type is always correct, but because the wrong type makes a clear story look ambiguous.
Annotate sparingly and in plain language. A vertical line on the week pricing changed. A label on the one bar that crossed the threshold. A note on the axis explaining the unit. The goal is to reduce questions about the chart so the room can argue about the decision. If people are squinting at legends, the chart is doing too much.
Size follows the same logic. One chart should use the space a dashboard would have consumed. Small multiples inside a single frame are still one argument if they answer one question — for example, the same metric across four regions to show the problem is localized. Twelve unrelated KPIs in the same space is a dashboard wearing a single-slide costume.
When You Actually Need More Than One
Two charts are justified when the decision requires two linked claims that cannot merge cleanly. "Revenue fell" and "the fall started when we paused ads" might need a revenue line and a spend line with aligned dates. That is still a single narrative with two pieces of evidence, not an overview.
Exploration is the other exception. When you do not yet know the headline, build a dashboard for yourself. Filter, drill, compare. Once the story crystallizes, export the one view that proves it and delete the rest from the deck. The dashboard was a tool for thinking. The slide is a tool for agreeing.
Signs You Should Delete Panels
The title says "Overview," "Summary," or "Dashboard." Those words usually mean the author has not decided what matters. Rename the slide after the claim, not the format.
You added a panel because the data was available, not because the meeting needs it. Availability is not relevance. The churn chart is on the slide because you already had it, not because anyone asked about churn.
Each chart could start its own conversation. That is a sign you have bundled several meetings into one. Split them, or pick the conversation that matches the decision on the agenda.
The main chart is smaller than a quarter of the slide. If the important thing is hard to see, the layout is serving the grid, not the argument.
One Chart in Practice
Imagine a product team asking whether to delay a feature launch. The tempting slide has active users, bug counts, NPS, sprint velocity, and a roadmap timeline. The decision slide has one line: weekly active users in the cohort affected by the feature, with the proposed launch date marked and a shaded band showing the historical dip after past launches. The conversation stays on whether the dip is acceptable, which is what the meeting was for.
The other metrics are not wrong. They belong in a monitoring dashboard, a written status doc, or a follow-up for a different audience. Mixing them into the decision slide only gives the room permission to defer.
Getting to that single view usually means iterating — plot, discard, plot again. Tools that let you switch chart types on the same dataset without rebuilding from scratch make that loop short enough to actually run before the meeting. The output is one image. The work behind it is many rejected ones.
Dashboards and single charts are not rivals. They serve different parts of the same workflow: dashboards for breadth and return visits, one chart for depth and a specific outcome. Confusing the two is how good data turns into long meetings with no decision. When the meeting has one verb, give it one visual.
Find your one chart
Import CSV, Excel, or JSON in VantaViz, try different chart types on the same data, and export the view that makes your point — processed locally on your device.
Get Started Free